Better Decisions Start Here: Explore WP Engine’s Enhanced Portal Insights
Advanced features now allow all customers to review usage and performance at both a single-site and account level, empowering deep analysis directly from the User Portal
Great WordPress® experiences don’t just happen out of the box—it takes a mix of the right tools and features to build robust, performant site environments.
We’re committed to helping our users get the most out of their digital experiences at WP Engine. That’s why we’re excited to introduce a robust new set of features designed to provide a deeper understanding of site and account performance and give our customers actionable data at their fingertips.
These account-level and site-level metrics help our users better understand the performance of their current sites, identify poor-performing pages, compare important metrics, and make more informed decisions regarding future optimizations and opportunities.
Whether you’re a developer, site owner, marketer, or executive, read on to learn how these insights can help you make data-driven decisions faster than ever!
What’s new in the User Portal?
WP Engine already offers several features that help our users gain insights into account usage and performance across their site instances on our hosting platform. The following new additions provide even more granular oversight so you can confidently hone your experiences.
Here’s a quick overview of what’s new in the WP Engine User Portal.
Performance scores: A quick, color-coded performance pulse check
Many tools can monitor the overall status of the sites you manage.
Updates to the Performance tab within the WP Engine User Portal make it easier than ever for WP Engine customers to understand overall performance across their account, spot issues at a glance, and take decisive action on opportunities for improvement.
Google Lighthouse Scores at the top of the Performance page provide a familiar external perspective for site performance and user experience, and are made readily available to view on a per-environment basis as you dive deeper.
The main view under the Performance tab is an overview of Google Lighthouse scores across all environments tied to an account on our hosting platform. From there, users can click into individual site environments for more granular insights.
Site-level insights: See what’s happening, when it happens
By clicking on an individual site instance in your Performance tab, users get even more details about the performance of each site hosted with WP Engine.
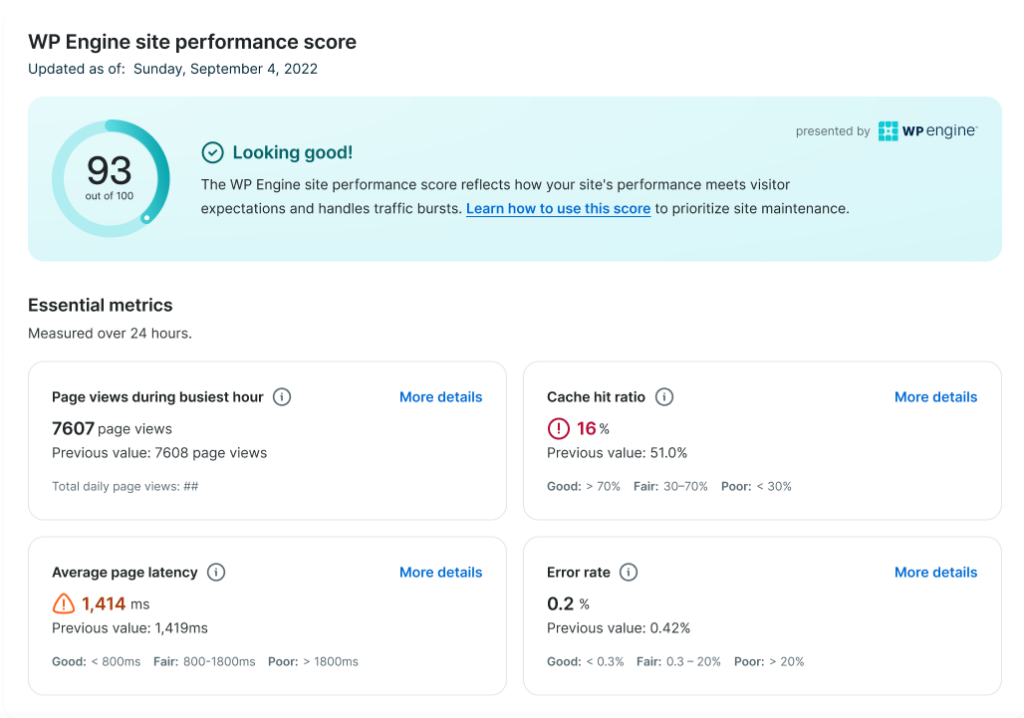
Along with site-specific Google Lighthouse Scores, the WP Engine site performance score is a proprietary measurement that compares its performance and reliability metrics across all sites on WP Engine’s hosting platform.
We’ve also introduced these additional metrics, so you can dive deeper into each site you manage through an easily accessible overview of performance on a site-by-site basis.
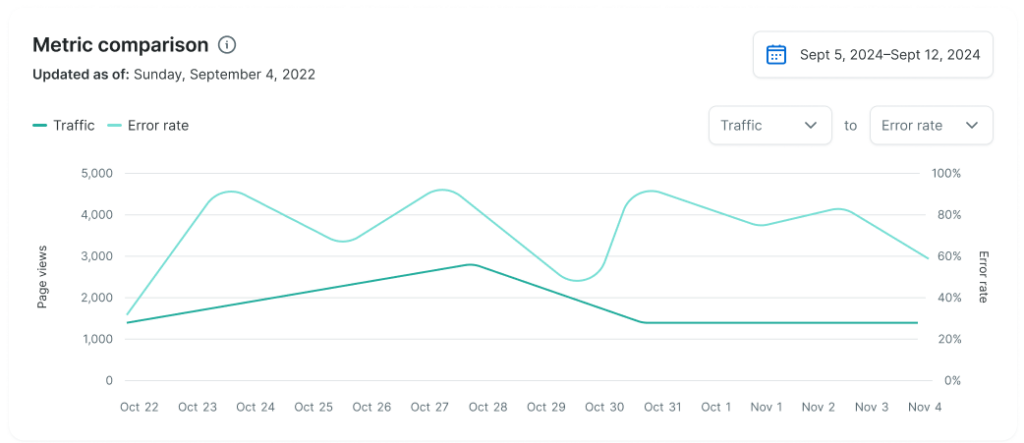
- Reports over time: See how your Google Lighthouse Scores have fluctuated over a specific time frame.
- Average latency over time: Understand how quickly your site loads.
- Page views during busiest hour: View daily and peak-hour traffic to anticipate resource needs or identify unusual activity.
- Error rates (%): See how often your site visitors encounter errors so that you can investigate the root cause.
- Cache hit ratio: Learn how often your site’s content is served via fast, cached delivery.
- Slow pages: Pinpoint which pages are lagging and require further optimization.
Each of these metrics is designed to help you understand how a site is performing and identify opportunities for improvement.
Exportable site-level reports
Need to brief your leadership team or collaborate with client stakeholders who don’t log into the WP Engine User Portal every day? No problem.
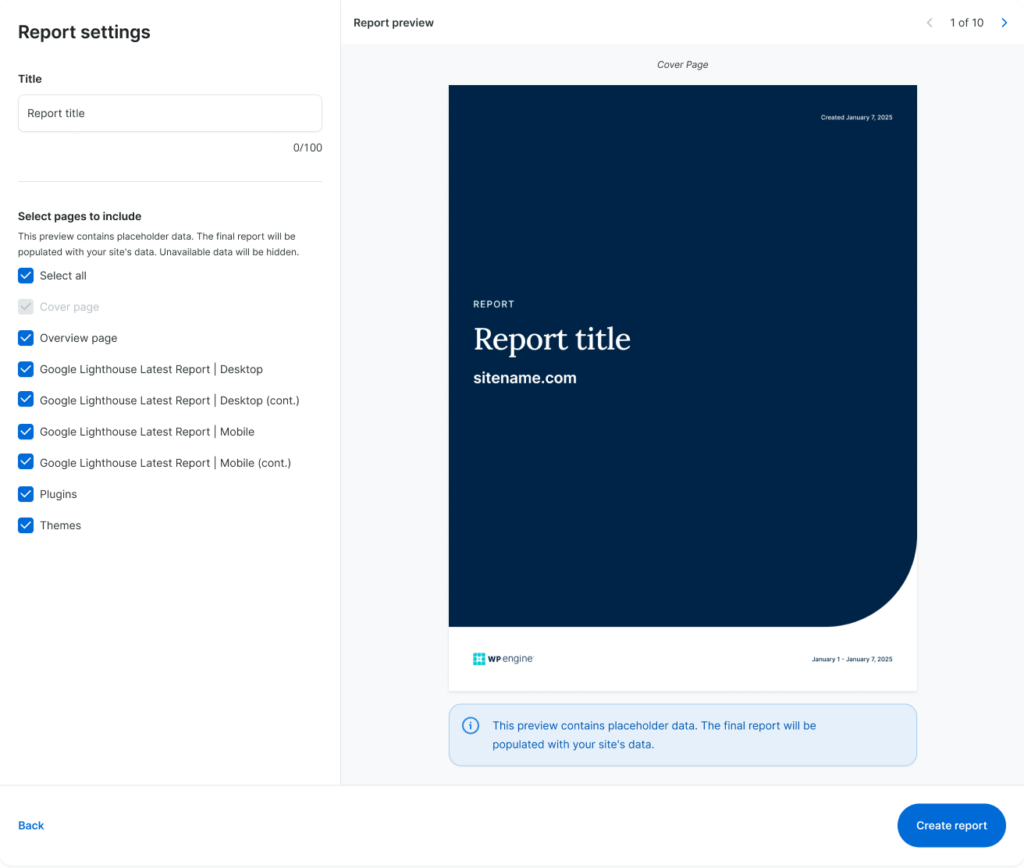
New exportable site summary reports deliver key metrics in a clean, executive-friendly format—perfect for monthly updates, board meetings, or quick wins with clients.
Head to the Reports tab under the Insights section to generate a new report. Simply decide which metrics you want to include or exclude from your report, give it a title, and you’ll get an instant PDF report about a specific site tied to your WP Engine account.

Account-level metrics: Understanding usage and trends
Beyond individual sites, it’s essential to see how your entire account is performing.
New metrics in the Plan overview section of the Usage tab can help track important account activity, including details on storage usage, sites and environment types, bandwidth usage, and billable visits.
You can also view Usage by environment to see where storage and bandwidth are used most across your account.
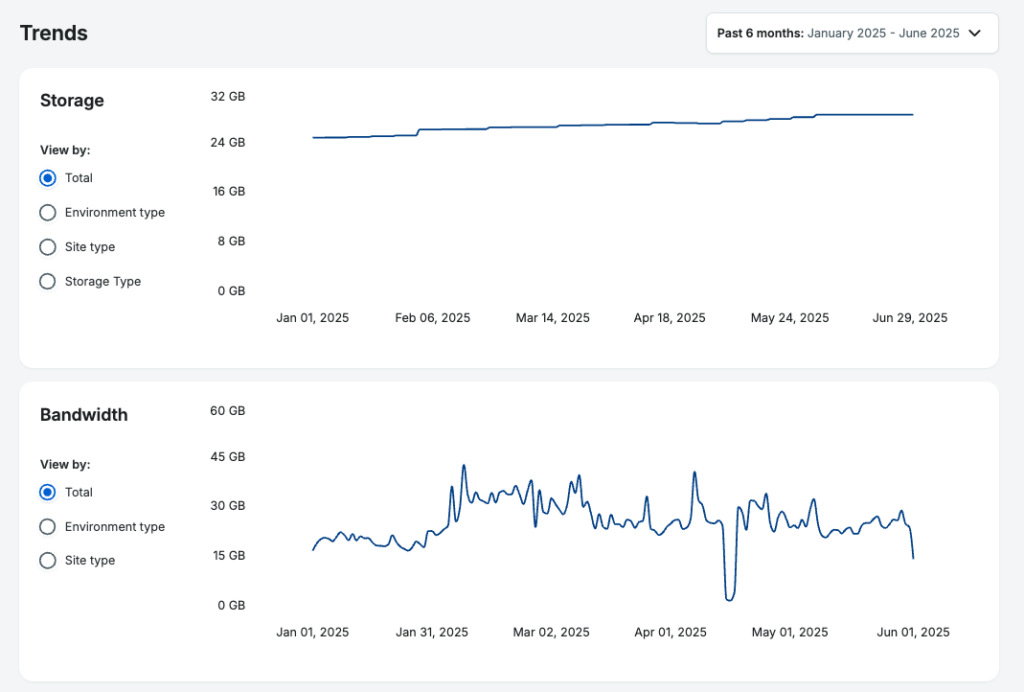
In the Trends section, you can view how storage and bandwidth have been used over a specific date range, filtering by environment type, site type, and storage or bandwidth type.
Finally, in the Extensions tab, you can view and manage existing licenses for product extensions like Global Edge Security and Smart Plugin Manager, allowing users to assign unused licenses to any available sites.
Each of these metrics is designed to help you get a better handle on your hosting resources, understand what’s being used, and see what’s at risk of overuse.
Why it matters
We introduced these tools to help our customers:
- Make decisions faster because precise data and visual cues help you prioritize issues.
- Improve site performance, so you can identify bottlenecks before they affect users.
- Share insights easily by exporting quick reports to loop in your team or clients.
- Stay proactive, not reactive, thanks to simple performance monitoring!
Check it out in the WP Engine User Portal!
These new insights are now available to all customers on all plan types!
Log in to your WP Engine dashboard to explore these powerful new tools and elevate how you manage your digital experiences.
Start the conversation.