Get Started

Key Takeaways
White-labeled Site Reports offer branded clarity. Agencies can now customize reports with their branding, enhancing client recognition and value demonstration.
Account-level insights streamline management. The All Accounts view simplifies overseeing multiple sites, providing usage trends, server health, and error monitoring in one dashboard.
Enhanced site-level insights for detailed troubleshooting. Performance metrics, traffic mapping, and error monitoring at the site level offer granular data for pinpointing and resolving issues.
Tools for smarter business decisions. WP Engine’s tools aim to equip users with the intelligence needed to make informed decisions and scale confidently.
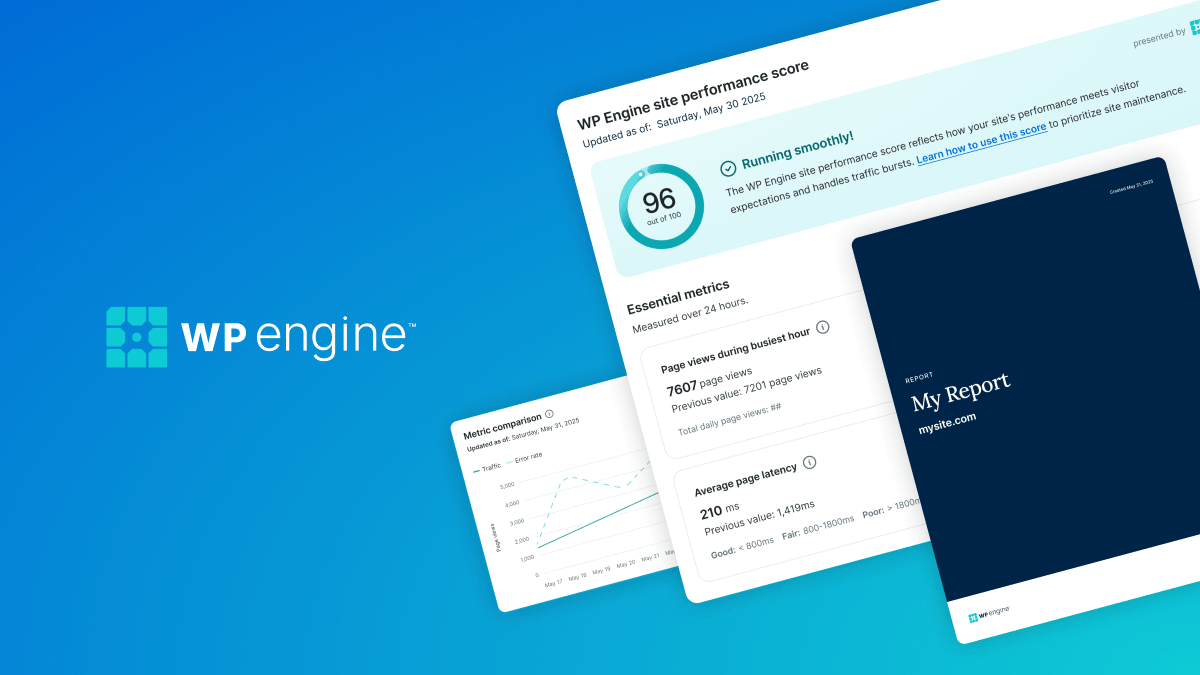
Schedulable, white-labeled reports are the latest WP Engine feature built to improve workflows for our customers
WP Engine teams are constantly finding new ways to optimize our customers’ experiences. Whether it’s through enhancing speed and security across our platform or building more intuitive workflows in our User Portal, our goal is to give you the tools you need to succeed.
Today, we’ve launched a long-awaited feature: the ability to create and schedule professional, white-labeled Site Reports. For agency customers, this means you can apply branding that your clients immediately recognize. This launch is the latest in a series of significant updates to our User Portal Insights view over the last year.
From high-level account visibility to detailed site-level performance alerts, let’s look at how the recent suite of features we’ve developed helps our customers move from reactive maintenance to proactive preparation.
Make it yours: Schedulable white-labeled reports
For many agencies, reporting is one of the primary ways of demonstrating value to clients. Our Site Reports feature provides a comprehensive view of an environment’s health, performance, and stability.
But data is only half the story. Presentation matters. With our latest update, you can now implement:
- Custom branding: Easily apply custom colors and replace WP Engine logos with your own branding to ensure every report looks like it came directly from your team.
- Design templates (Coming soon): Save your branded designs as templates to maintain consistency across your entire client portfolio.
Our customers can schedule these branded reports to send automatically to up to 20 recipients per site environment on a weekly, bi-weekly, or monthly basis. And because not every stakeholder needs to see every metric, you can select specific data points to include, creating focused views for different audiences.
The bird’s-eye view: Account-level insights
Managing a handful of sites is one thing. Managing dozens or even hundreds of sites across multiple accounts is much more difficult. In December 2025, we launched the All Accounts view, specifically designed for agencies managing several isolated account portfolios.
Instead of manual digging, any user with Owner or Full User permissions can now access a single, scannable dashboard that aggregates:
- Usage trends: 30-day snapshots of storage and bandwidth usage across all accounts.
- Server health: Real-time tracking of PHP and MySQL CPU/memory utilization to identify over- or under-capacity accounts.
- Error monitoring: Immediate visibility into 500, 502, and 504 errors to identify issues early.
This feature is available for Premium, Premier, and C plans and requires that the Owner or Full User profile belong to at least two dedicated hosting accounts.
Granular visibility: Site-level insights
While account-level views help you manage the big picture, our enhanced site-level insights help you drill into the details. We’ve added more granular data to the environment level, giving you the precision needed to troubleshoot specific bottlenecks.
Access the Performance Insights section of any account you manage to review:
- Environment-level usage: View bandwidth trends by environment, location, and URI, review billable visits and total visits by date, and see a list of the top 50 largest files on your site to quickly clear bloat.
- Traffic mapping: Analyze page requests by country, day of the week, and peak hour to better understand your audience’s behavior.
- Performance metrics: Monitor average page latency, cache hit ratios, and Google Lighthouse scores directly within the User Portal.
- Error monitoring: Investigate error rates, including patterns and trends in error rates and status codes by country, to know when and where issues are emerging.
Users can also opt in to receive performance notifications via the User Portal, email, or Slack.
We rate performance metrics on a 3-tier scale: Poor, Fair, and Good. Instead of getting pinged for every minor fluctuation, you’ll only be notified when a site’s performance score degrades between states. For example, if your scores drop from Good to Fair or from Fair to Poor, you’ll receive a message, so your team can activate on issues the moment they arise.
More clarity, more control
Our approach to hosting isn’t just about keeping you online; it’s about building true partnerships that equip our customers with the tools and intelligence they need to make smarter business decisions. Whether you’re an agency looking to impress clients with branded reports or an in-house team that wants to reduce the time you spend identifying performance issues, our tools are built to help you scale with confidence.
Log in to your WP Engine User Portal to explore the Insights view and schedule your first white-labeled report.