
How to Properly Inspect a Website
Whether you’re a developer testing new features on a project or a designer wanting to look closer at HTML and CSS code, there are many reasons for inspecting a website and its elements. However, knowing where to start may seem confusing (at first).
Fortunately, you can use various simple tools, techniques, and tricks to inspect web elements properly. Plus, there are options for nearly every browser and Operating System (OS).
In this post, we’ll discuss why you might want to inspect a website. Then we’ll walk you through some of the best tools you can use before explaining what to look for. Let’s jump in!
Why You Should Inspect a Website
There are several reasons why you might want to inspect a website. For example, you may need to troubleshoot an issue or find a specific piece of information.
Inspecting web elements in a browser lets WordPress developers, designers, and digital marketers manipulate the appearance of a web page and test changes. Developers or testers are more likely to use this feature to debug a particular element, conduct layout tests, or perform live CSS editing.
Inspecting web elements is also helpful for web designers. If you want to quickly test a color change or a new font, you can do so without digging into your CSS code.
Additionally, digital marketers can use an Inspect Element tool to see how certain changes would affect a web page’s overall look and feel. For example, you might want to try a new Call To Action (CTA) button or a different color scheme. You can use tools to replicate the updates without making any changes to your live site.
Finally, inspecting a website can be an excellent way to learn about how a website is built and functions. If you’re interested in learning more about web development, inspecting sites is an excellent way to get started.
Understanding ‘Inspect Element’: Key Concepts
‘Inspect Element’, often referred to as browser developer tools, is a powerful built-in feature in modern web browsers that allows users to look “under the hood” of a webpage. In simple terms, it’s like having X-ray vision for websites. These tools provide a direct view into a website’s underlying code—primarily its HTML (HyperText Markup Language) structure, CSS (Cascading Style Sheets) styling, and JavaScript behavior. Understanding how to inspect element provides invaluable insights into web development.
The core functionalities of these developer tools are extensive. You can view and temporarily edit the HTML to see how content structure changes affect the page. Similarly, you can modify CSS rules to experiment with different styles, colors, fonts, and layouts in real-time. For developers, the JavaScript console is crucial for debugging scripts, logging information, and interacting with the page programmatically. Network analysis tools within the inspector allow you to monitor how assets like images, scripts, and stylesheets are loaded, helping to identify performance bottlenecks.
Learning how to inspect a website using these features is a fundamental skill for web professionals and enthusiasts. It’s important to remember that any changes made using ‘Inspect Element’ are temporary and only visible in your browser session; they do not alter the actual website files on the server. This makes it a safe environment for testing, learning, and troubleshooting without any risk of breaking the live site.
Best Tools and Extensions to Inspect a Website
There are a number of different tools and extensions that you can use to inspect a website. Here are some of the most popular options!
Inspect Element
The Inspect Element Tool is the most common option. It lets you look closely at the HTML and CSS code that makes up a web page. You can also use it to live-edit the CSS and see how your changes would look without making any permanent alterations.
Although it’s available as a Google Chrome extension, the Inspect Element tool also comes with all major browsers. The feature is part of Chrome Developer Tools, a set of programs that enables you to inspect and edit a web page’s HTML and CSS code.
To access Google Chrome Developer Tools, simply press Ctrl+Shift+I (or Cmd+Opt+I on a Mac). You can also access the tools by opening the Chrome menu and selecting More tools > Developer tools:

You can access the same developer tools in other browsers. For instance, Firefox Developer Tools has similar features. To access the tools, simply press Ctrl+Shift+I (or Cmd+Opt+I on a Mac). You can also find the tools by opening the Firefox menu and selecting Web Developer > Inspector.
Furthermore, Safari Developer Tools enables you to inspect and edit a web page’s HTML and CSS code on Mac devices. Simply press Cmd+Opt+I. You can also open the Safari menu and select Preferences > Advanced > Show Develop menu in the menu bar.
BrowserStack
Another platform you can use for testing websites is BrowserStack:

This cloud-based testing platform works with all major browsers and devices. After signing up for a free trial, you can navigate to the Live dashboard and choose your OS.
Then, you can select your preferred browser version to launch a Live session in your browser. Finally, you can navigate the website you want to inspect as you would via Inspect Element.
How to Inspect a Website
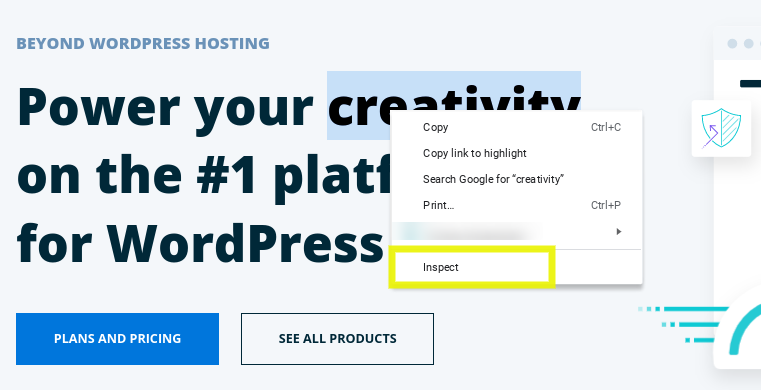
Let’s take a look at how you can inspect a website using the Inspect Element tool. Start by simply right-clicking on any web page element and selecting Inspect from the context menu:
This will open up the Inspect Element tool in your browser. Once the tool is open, you can start manipulating the HTML and CSS code to see how it would affect the web page’s appearance.
For example, you can change the color of an element, add or remove a class, or even change the position of an element. You can also use the search field at the top to search for a piece of text or an image.
Of course, any changes you make using Inspect Element are only temporary. They will not be saved when you refresh the page or close the browser. However, this is a great way to trial how specific changes would look without permanently altering your website.
You can also access the tool by pressing Ctrl+Shift+I (or Cmd+Opt+I on a Mac) to open the Developer tools. Then, click on the Elements tab at the top of the window:

Finally, you can also access Inspect Element by opening the Chrome menu and selecting More tools > Developer tools, which we discussed earlier.
Utilizing Firefox Developer Tools for Inspection
- Accessing Firefox Developer Tools: Similar to Chrome, the easiest way to open Firefox Developer Tools is to right-click on an element on a webpage and select “Inspect Element” (or simply “Inspect” in newer versions). Keyboard shortcuts are also available: Ctrl+Shift+I (Windows/Linux) or Cmd+Opt+I (macOS). Alternatively, navigate through the Firefox menu (hamburger icon in the top-right) to “More tools” and then “Web Developer Tools.” This is fundamental for anyone learning how to inspect a page in Firefox.
- Key Panels in Firefox:
- Inspector Panel: This is Firefox’s equivalent of Chrome’s Elements panel. It displays the HTML DOM tree of the page. You can explore and modify the HTML structure here. It’s central to any website inspection task.
- Rules View (within Inspector): When an element is selected in the Inspector, the Rules view (typically on the right) shows the CSS rules applied to it. You can edit existing styles, add new ones, and see how they affect the element.
- Console Panel: The Web Console is used for JavaScript debugging, logging information, and executing JavaScript commands.
- Style Editor Panel: Firefox offers a dedicated Style Editor panel, which allows you to view and edit all stylesheets associated with the page. You can create new stylesheets or modify existing ones, making it a powerful tool for CSS work beyond just inspecting individual elements.
- Common Inspection Tasks in Firefox:
- Selecting Elements: Use the element picker icon (often a rectangle with a pointer) in the top-left of the Developer Tools to select elements by hovering and clicking on them on the page.
- Modifying CSS: In the Rules view, you can click on CSS properties or values to change them. Add new declarations to existing rules or to the inline style of an element. Understanding how to inspect element styles is key for quick design iterations.
- Editing HTML: Right-click an element in the Inspector panel and choose “Edit As HTML” to modify its structure or content.
- Unique Firefox Features: Firefox Developer Tools often include advanced features like a Grid Inspector for CSS Grid layouts, a Flexbox Inspector for Flexbox layouts, and robust accessibility inspection tools. The Font Inspector is also very useful for examining and modifying typography. These make Firefox a strong choice when you need to inspect website layouts and accessibility.
Leveraging Safari Web Inspector
- Enabling Web Inspector: Before you can use Safari’s Web Inspector, you might need to enable the Develop menu. Go to Safari > Preferences > Advanced, and check the box at the bottom that says “Show Develop menu in menu bar.” Once enabled, the Develop menu will appear in Safari’s menu bar.
- Opening Web Inspector: With the Develop menu enabled, you can right-click on any element on a webpage and select “Inspect Element.” Alternatively, use the keyboard shortcut Cmd+Opt+I (macOS). You can also open it from the Develop menu by selecting “Show Web Inspector.” Knowing these steps is crucial for learning how to inspect element in Safari.
- Navigating Web Inspector Interface:
- Elements Tab: This tab displays the page’s HTML DOM structure. You can navigate the tree, select elements, and see their relationships. This is the primary area for website inspection of structure.
- Styles Pane (within Elements Tab): When an element is selected in the Elements tab, the Styles pane (usually on the right) shows the CSS rules applied to it. You can edit these styles, add new ones, and see the computed styles.
- Console Tab: The Console is for JavaScript debugging, viewing logs, and executing JavaScript code.
- Sources Tab: This tab allows you to view and debug JavaScript files, as well as inspect other resources like images and stylesheets.
- Network Tab: Useful for analyzing network requests, load times, and resource loading.
- Common Inspection Tasks in Safari:
- Examining HTML Structure: Use the Elements tab to explore the DOM. Click the element selection icon (often a crosshair or pointer) to select elements directly from the webpage.
- Modifying CSS: In the Styles pane, click on CSS properties or values to edit them. You can also add new CSS rules directly in this pane for quick testing. This is a core part of how to inspect a page for visual changes.
- Debugging JavaScript: Use the Console for error messages and the Sources tab to set breakpoints and step through JavaScript code.
- Specific Considerations for Safari: Safari’s Web Inspector has a clean interface and offers robust tools particularly useful for iOS and macOS development, including a Timelines tab for performance profiling and a Storage tab for inspecting cookies, local storage, and session storage. Its rendering engine (WebKit) is different from Chrome’s (Blink) and Firefox’s (Gecko), so testing in Safari is important for ensuring cross-browser compatibility.
How to Change an Element
If you want to change an element on a web page, right-click on it and select Inspect. In the Elements panel that opens up, find the part you want to change and double-click on it.
When you open the Elements box, you can use the Inspect cursor icon to the top-left of the panel to highlight the source code of the element you want to modify. When you right-click on the highlighted code, select Edit as HTML:

The box will expand, then you can change the text. To preview the changes, you can deselect the element. You can also double-click on the text to edit it.
You can also use this technique to change the CSS code for an element. To do this, right-click on it and select Inspect. In the elements panel, locate the element you want to change and choose the element.style property. Then you can add your code or declarations in curly brackets.
How to Hide or Delete an Element
You may also want to hide or delete an element on a web page. Once you’ve found the element you want to hide or delete, right-click on it and select Inspect to launch the Inspect Element tool.
From here, right-click on the element, then select the Delete element or Hide element option:
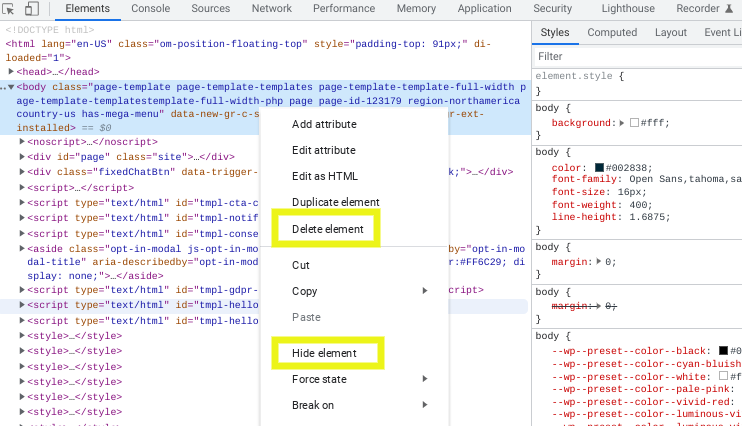
The Delete button removes the Document Object Model (DOM) element. The Hide button will simply hide the element, but it will still be in the DOM.
How to Inspect CSS Classes
There are several ways to inspect CSS classes. However, the easiest method is to right-click on the element you want to review and select Inspect. Then open the Styles tab to see its CSS styles:
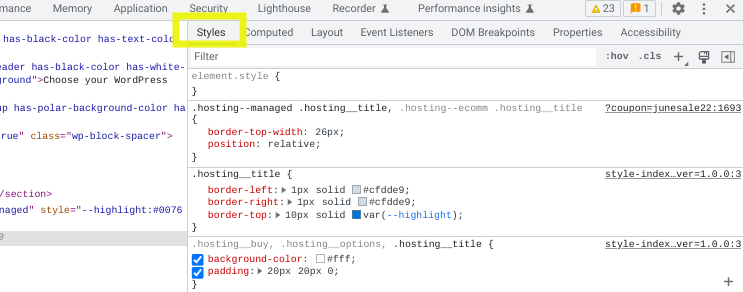
Note that this tab only shows you the inline styles that are applied and not those that come from a style sheet.
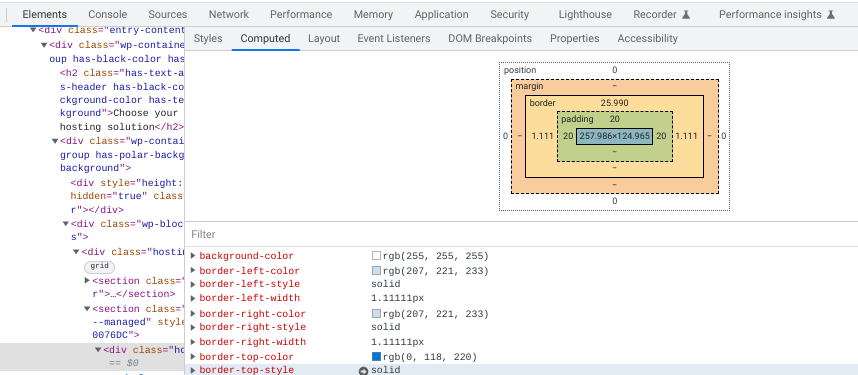
If you want to see all of the CSS styles that are applied to an element, you can use the Computed tab. It shows you all the CSS styles that are applied to an element, including those from a style sheet:
When you finish inspecting a web page, simply close the Inspect Element tool. Your changes will not be saved, so you don’t have to worry about accidentally breaking something.
Inspecting Websites on Mobile Devices
Inspecting websites on mobile devices like iPhones and Android phones is crucial for responsive web design and debugging mobile-specific issues. While direct, on-device developer tools are limited, remote debugging is a powerful technique. For Android devices, you can use Chrome Developer Tools. Connect your Android device to your computer via USB, enable USB debugging in developer options on your phone, and then navigate to `chrome://inspect#devices` in Chrome on your desktop. You can then select your device and the tab you want to inspect, opening a DevTools window that mirrors your mobile browser. This allows you to fully inspect element behavior on the mobile device.
For iOS devices (iPhone/iPad), Safari Web Inspector on a Mac is the primary tool. Connect your iOS device to your Mac via USB. On your iOS device, go to Settings > Safari > Advanced and enable “Web Inspector.” On your Mac, open Safari, go to the Develop menu (if not visible, enable it in Safari Preferences > Advanced), and you should see your connected iOS device and its open Safari tabs listed. Selecting a tab will open the Web Inspector for that page, providing a comprehensive way to inspect a page as it appears on your iPhone or iPad. For users without access to a desktop for remote debugging, some mobile browsers offer limited built-in inspection capabilities, or you might find third-party apps or web-based services like BrowserStack (mentioned earlier) that emulate mobile environments and offer debugging tools, though these may not be as robust as direct remote debugging when trying to inspect website elements on the actual device.
What to Look For When Inspecting a Website
Whichever method you use to access Inspect Element, you will see the same interface. It consists of two panes: the HTML pane and the CSS pane.
The HTML pane shows you the structure of the web page. You can see how the various elements are nested and related.
The CSS pane shows you the styles applied to the selected element. You can also edit the CSS rules to see how your changes would affect the element’s appearance.
If you’re looking for something specific on a website, whether a certain piece of text or an image, you can use Inspect Element to help you find it. It has a search field where you can look for a particular element.
When you’re inspecting a website, there are a few things to keep in mind:
- HTML: The code that defines the web page’s structure. Pay attention to the way that the elements are organized and how they interact with each other.
- CSS: The code that defines the style of the web page.
- JavaScript: The code that defines the behavior of the web page. It influences how the elements interact and how the page responds to user input.
- Design: The overall look and feel of the website. It influences how user-friendly the layout is and how well it fits the website’s purpose.
- Content: The website’s text, images, and other media.
What you should look for when inspecting a website will depend mainly on whether you’re a designer, developer, or digital marketer. As we discussed earlier, the Inspect Element tool can help you with everything from design testing to troubleshooting issues.
Common Use Cases for Website Inspection
- Debugging HTML structure and CSS layout issues: This is one of the most common uses. If an element isn’t appearing where you expect, or if styles aren’t applying correctly, learning how to inspect the HTML and CSS can quickly reveal problems like typos, incorrect selectors, or conflicting styles. You can directly see the box model (padding, border, margin) which is invaluable for layout troubleshooting.
- Live-editing and testing design changes: Before committing to code changes, you can experiment with different colors, fonts, spacing, and element positioning directly in the browser. This allows for rapid prototyping and visual feedback when you inspect website designs. For example, you can quickly see how a new headline color or button size looks.
- Understanding how complex websites are built: By inspecting well-known websites, you can learn advanced HTML structuring techniques, CSS tricks, and JavaScript implementations. It’s a great way to see real-world examples and improve your own web development skills. A thorough website inspection can be very educational.
- Checking SEO elements: You can easily inspect a page to verify critical on-page SEO elements like title tags, meta descriptions, header tags (H1, H2, etc.), image alt attributes, and structured data markup. This helps ensure your site is optimized for search engines.
- Analyzing page load performance and network requests: The Network tab in developer tools shows all resources loaded by a page, their sizes, and load times. This is essential for identifying bottlenecks that slow down your website, such as large images or slow-loading scripts. This form of website inspection helps optimize user experience.
- Modifying content for screenshot purposes or presentations: Sometimes you need to quickly change text or hide an element for a screenshot or a client presentation without actually altering the live site. The ability to how to inspect element and make temporary changes is perfect for this.
- Testing website responsiveness: Developer tools often include a device mode or responsive design mode, allowing you to simulate how your website looks and behaves on different screen sizes and devices. This is vital for ensuring a good user experience across desktops, tablets, and mobiles.
- Identifying JavaScript errors: The Console panel is invaluable for catching and debugging JavaScript errors that might be breaking functionality on your site. Error messages often point directly to the problematic code.
Conclusion
Inspect Element is a valuable feature for designers and developers. You can use it to view and edit the HTML and CSS of a web page. This tool can be helpful when you want to make changes to a web page you are working on or see how it’s coded.
Inspect Element is available in most web browsers. You can access it by right-clicking on a web page and selecting Inspect from the menu. Once you have opened the Inspect window, you will see the HTML and CSS code for the web page and can make various changes.
Do you need help with your website management or optimization? Learn how WP Engine can help with everything from hosting for WordPress sites to site and client management!