Get Started


Key Takeaways
WordPress plugins offer easy data visualization solutions. Plugins like wpDataTables, Data Tables Generator, and Visualizer help create charts and graphs without coding knowledge.
Cost-effective options are available for data visualization plugins. Prices range from free versions to premium upgrades starting at $44 per year.
Different plugins cater to specific industries and needs. Each plugin has strengths and weaknesses suitable for finance, marketing, education, and more.
Leaders can enhance data presentation on WordPress sites. By utilizing these plugins, businesses can improve data accuracy and user engagement.
Whatever the nature of your online business, data is likely a critical component of your operations. Without a proper way to display that data, you could be short-changing yourself and your stakeholders. For best results, you need a method for presenting data in an accurate and easily transferable fashion.
Fortunately, WordPress users have easy access to plugins that can help with WordPress data visualization and Business Intelligence (BI) reports. These can be used to retrieve and organize data according to your needs, and display that data in a neat, professional way.
In this post, we’ll introduce a few of the best WordPress plugins for data and BI reports. We’ll then break down each tool according to its costs, strengths, and weaknesses. Let’s get started!
Best WordPress Plugins for Data Visualization and BI Reports

1. wpDataTables
The wpDataTables plugin offers a way to more easily create charts and graphs for your WordPress website. It uses the Google Charts engine, and can accept data from a number of sources. These include Excel sheets, CSV data formats, JavaScript Object Notation (JSON), XML, and Serialized PHP arrays.
Price: This is a free WordPress data visualization plugin, with premium upgrade options that start at $44 per year (or $210–485 for lifetime access depending on the number of sites).
Pros: With wpDataTables, you can create useful data visualizations in your WordPress website, without any coding knowledge.
Cons: Many of the common data sources, such as Google Sheets, are not compatible with the free version of the WordPress plugin. Additionally, manual creation is only available with the premium version.
This visualization plugin is also fully compatible with the popular page builder WPBakery. In combination with the extensive list of acceptable data, wpDataTables is a good choice for:
- Finance
- Marketing statistics
- Website analytics
- Health and wellness
- Education
Having the flexibility to use data from a variety of sources makes this a very versatile and useful tool. Whether it’s for internal view or creating dynamic and interesting content for your site’s users, wpDataTables is worth checking out.
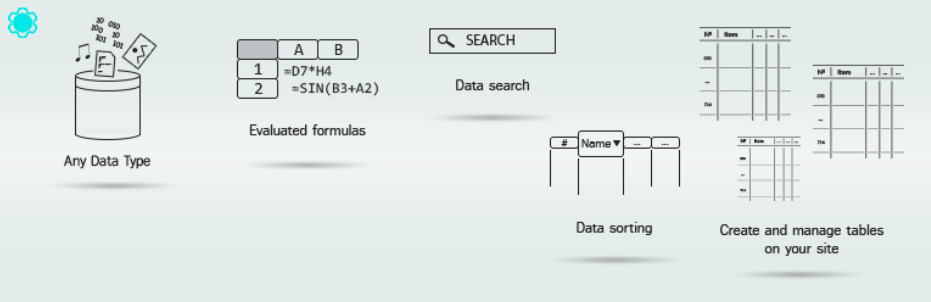
2. Data Tables Generator by Supsystic
The Data Tables Generator plugin by Supsystic enhances your ability to create tables and graphs in WordPress. Although these elements are typically difficult to design without coding knowledge, this tool enables you to create responsive charts, tables, and graphs with sortable and searchable data.
Price: Data Tables Generator has a free version with many table styling options. The upgrade starts at $89, and gives you full access to a long list of premium features.
Pros: This plugin comes with front-end editing you can use to add images and custom styling to your tables, and is highly-rated.
Cons: The free version is somewhat limiting, and there is a learning curve involved.
Data Tables Generator offers interactive options that make it a useful choice for several specific areas, including:
- Education
- Finance
- Project management
If you want users to be able to interact with your tables and WP charts, Data Tables Generator can help.
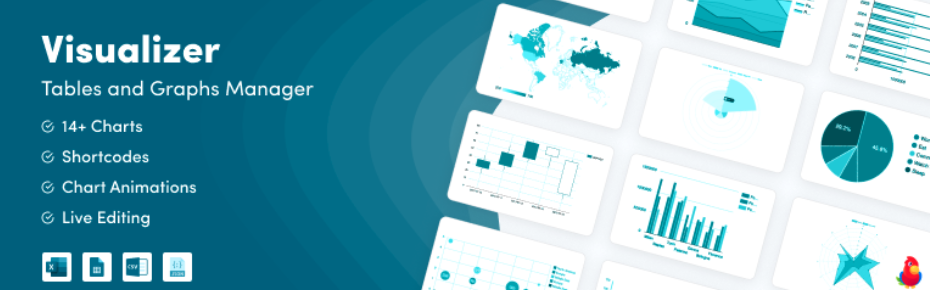
3. Visualizer: Tables and Charts Manager for WordPress
Using Visualizer: Tables and Charts Manager for WordPress, you can easily create interactive data displays on your WordPress pages and posts.
With the Lite version, you can import data from CSV and Google Spreadsheets. When you upgrade to Pro, you can also import from WordPress, as well as gain access to the front-end editor and three additional chart types.
Price: The Lite plugin is free, but you can upgrade to the Pro version starting at $99.
Pros: There are multiple chart types (15 with the Pro version), plus a live editor and the option to import from CSV and Google Spreadsheets.
Cons: You cannot retrieve data from MySQL databases.
The broad swathe of WordPress data visualization options offered by this plugin make it suitable to virtually all industries. However, it is a best match to the following sectors:
- Finance
- Science
- Health
- Marketing
- Technology
Visualizer lets you automatically sync charts with online files. This makes it a great option if you want to visually present your WordPress SQL and data reports quickly and efficiently.
Learn More About WP Engine’s WordPress Expertise for Your Business
Are you interested in learning more about how WordPress can be used to improve your business? Tap into WP Engine’s WordPress hosting expertise on our blog, or take a look at our variety of managed hosting plans.
With WP Engine on your side, you’ll always be up to date on the latest WordPress news and developments, making the process of running you website and your business a breeze!