

The Journey to WP Engine’s New Site Monitoring Tool
Product, UX Design and Research teams led the way through ideation, iteration, and implementation
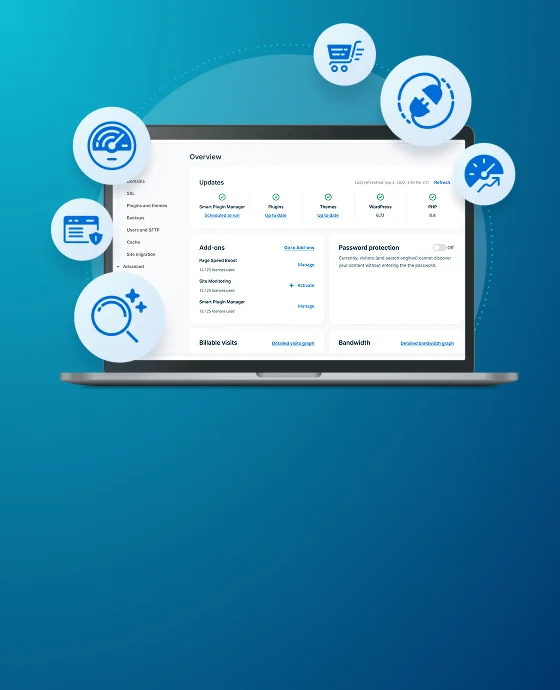
WP Engine’s new Site Monitoring tool was launched earlier this year as a way to help our customers gain critical visibility into outages, uptime, and average response times across their portfolio of websites.
Like all of the tools and products we release, months of ideating, testing, and gathering user insight went into making Site Monitoring possible, and none of it could have happened without a lot of hard work and collaboration among our UX Research, Engineering, Design, and Development teams.
This new add-on feature was once just a concept, and the long journey toward General Availability was not without its challenges. Read on to hear how WP Engine’s teams used a collaborative approach to conceptualize, create, test, and release Site Monitoring to our users.
What Is Site Monitoring?
If you’re responsible for building and maintaining websites, you never want to hear that a site is down—especially when your boss or your client is the one who has to call and tell you there’s a problem. Site Monitoring is a way to proactively keep tabs on the sites you manage to ensure errors are detected and reported quickly, so they can be resolved before becoming larger issues.


Conceptualizing Site Monitoring
The road to Site Monitoring began the way many of our products do: with customer research. WP Engine’s UX Research team was at the ground floor of the process, kicking things off by conducting user interviews and sending surveys to current customers, asking about their experience overall, their needs, and their desires.
What the team uncovered was that, despite their different roles, responsibilities, and geographic locations, the users they interviewed wanted the same thing: a single tool they could use to monitor multiple client sites for outages at a glance and identify issues before clients realized there was a problem.
From there, the UX Research team began ideating on a solution. First, they reached out to members of WP Engine’s Engineering team who identified a piece of partner software that would allow them to address uptime monitoring. After some trial and error, the teams were ready to submit the initial concepts for what would become Site Monitoring.
“We showed users the ideas that our designers came up with alongside our engineers, which allowed them to focus on the ideas more than the design,” said WP Engine Associate Researcher Kate Meyer. “The users’ expectations were aligning with our vision, so we started building.”
After initial concepts were presented, select users were allowed to opt into a beta testing phase, and the actual product design began in earnest.

Ideation, Creation, and Implementation
The workflow for beta testing the new tool and designing new iterations was a cyclical one. When the first iteration of beta was released, it generated feedback from both users and developers. The design team would use that feedback to make their changes before passing the project onto the Prod Quad (formerly known as the Triad, now with four members), which is a smaller team comprised of a Product Manager, Product Designer, UX Researcher, and Engineering Manager all working together.
Once that group came to a consensus on the changes, the project would move to the development team which would ideate on the best way to bring the new design vision to life. After the development team made their changes, the updates would be released to beta customers who would then provide more feedback, starting the whole cycle over again.
One of the most important pieces of feedback our builders received during this process had to do with alerting on site outages.
“We knew users wanted and needed alerts, and that it would make monitoring more effective for them,” said WP Engine Senior Product Designer Kameron Fehrmann. “We also wanted to ensure our messaging was both understandable and actionable, so users could fix issues with ease.”
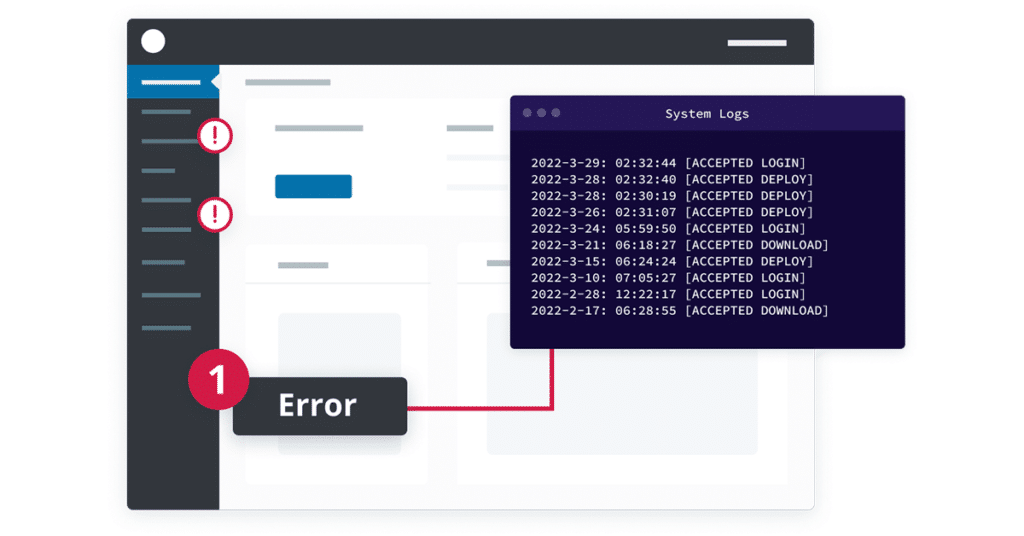
This feedback led to one of the most important pieces of the Site Monitoring tool: the email alert. Now, when a user adds Site Monitoring for a client site, they’ll receive an email alert as well as notifications within the portal, ensuring that site managers are made aware of outage issues the instant they’re detected.
User feedback also led to the implementation of other important features, including an explanatory element which tells users whether an outage is due to a problem on site or a wider outage on WP Engine’s platform, site-specific error logs, and a simplified process for adding, pausing, or deleting monitored sites.
The Future of Site Monitoring
Our teams’ work is never finished, and they are already looking into additional updates that will make Site Monitoring even more useful to more users. One that’s on the horizon is a notification integration with Slack, so site managers can choose the notification style that best matches their unique workflow.
“As we look ahead, we are certainly planning on integrating Slack as an additional alert channel, and we’re exploring SMS as well,” said WP Engine Product Manager Bryan Smith. “This really is V1, and we have so many plans in store, so stay tuned for more configuration options with the monitoring, more improvements to the user portal, and we’ll continue to follow the design process that led us to this point.”
Avoid Outages with Site Monitoring
WP Engine’s UX researchers, designers, and developers are continually working to improve the experiences of our customers, taking insight from actual users and creating new products to meet their most pressing needs.
Check out our DE{CODE} session about Site Monitoring to hear the full story behind how this tool came to be as told by the people who made it possible!
Start the conversation.